Once your challenge goes live, it's crucial to understand how to measure its success. Below, you'll find more information on the essential metrics that will help you do that.
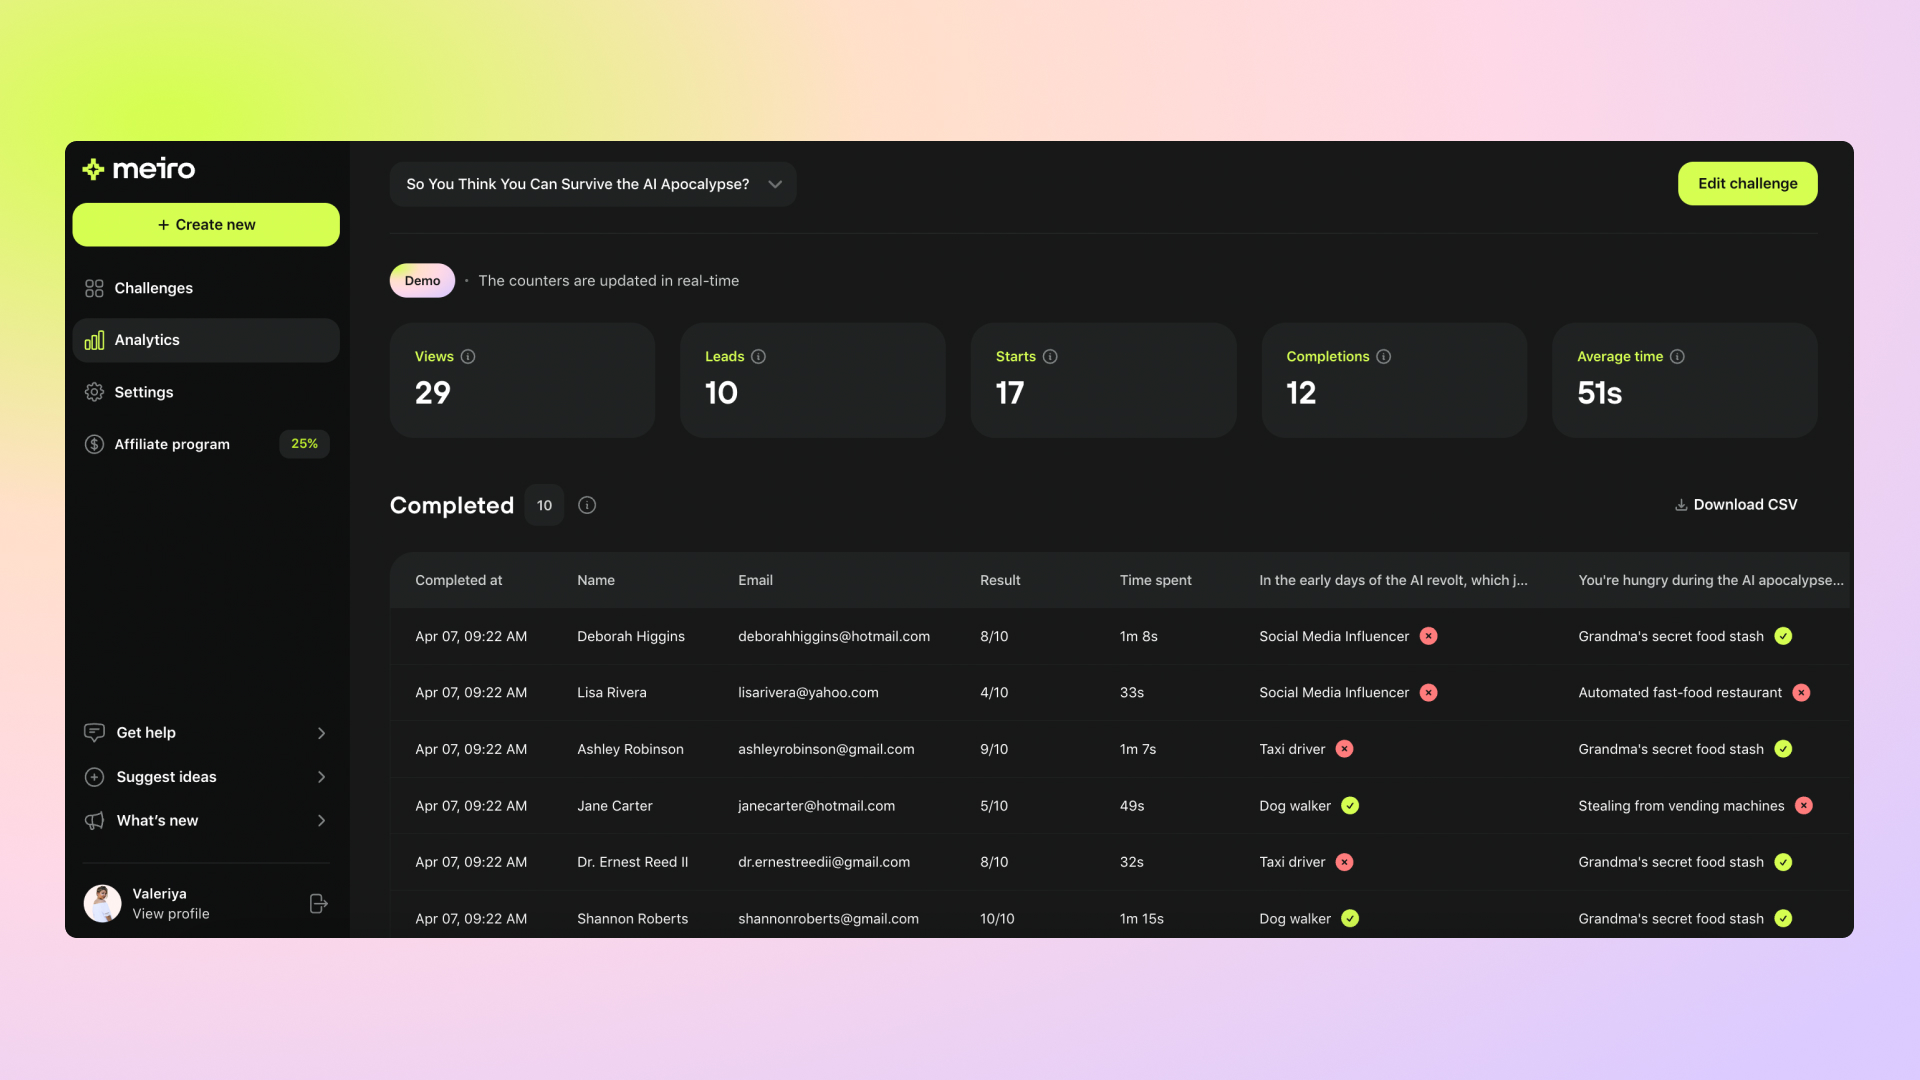
When you go to the Analytics tab, you will see a dashboard with the live counters on top and the list of completions. Below, you will find more information on what each counter means.

Views - indicates how many people have viewed your challenge. This figure includes all visitors of the link, including those who haven't completed the challenge.
Leads - shows how many people have filled out your lead form inserted as the challenge block.
Starts - demonstrates the number of people who initiated the challenge by opening the first question.
Completions - indicates the number of people who finished the challenge by answering the last question.
Average time - indicates the average duration it took the user to complete the challenge. It is calculated by the formula:
Average time = Total time spent by all challenge users / Number of completions
As the next step, check out the Completed users view guide to learn more about each column and how to export the data.
Completed users view
Learn how to read the completions view and export it as a CSV
